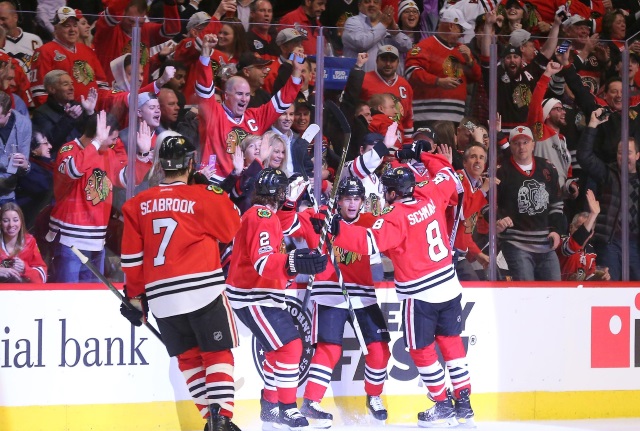
Here is our third installment looking at NHL attendance figures for this season. A look at each teams home attendance through 30 games, along with the arena capacity percentage.
We’ve also included the average attendance at the 20 and 10 game mark for this season, as well as the 30 game average for past two seasons.
16 teams are running at over 100 percent capacity through 30 home games this season, 20 teams at over 95 percent capacity.
Eight teams are under 90 percent capacity though 30 games, with four under 85 percent.
Only the Arizona Coyotes (76.8 percent) and Carolina Hurricanes (64 percent) are under 80 percent capacity.
Outdoor games obviously skew the numbers for some teams.
| RK | Team | 2016-17 30 GMs | Capacity | 2016-17 20 GMs | 2016-17 10 GMs | 2015-16 30 GMs | 2014-15 30 GMs |
|---|---|---|---|---|---|---|---|
| 1 | 21,682 | 110 | 21,593 | 21,595 | 21,781 | 21,706 | |
| 2 | 21,288 | 100.1 | 21,288 | 21,288 | 21,288 | 21,286 | |
| 3 | 20,027 | 100 | 20,027 | 20,027 | 20,027 | 20,027 | |
| 4 | 19,890 | 109.3 | 20,211 | 19,239 | 19,225 | 19,121 | |
| 5 | 19,644 | 106.1 | 18,444 | 18,273 | 18,207 | 18,211 | |
| 6 | 19,639 | 100.5 | 19,564 | 19,550 | 19,172 | 19,676 | |
| 7 | 19,092 | 100 | 19,092 | 19,092 | 19,092 | 18,709 | |
| 8 | 19,053 | 106.1 | 18,987 | 18,982 | 20,099 | 18,990 | |
| 9 | 18,632 | 96.6 | 18,560 | 18,500 | 19,157 | 19,049 | |
| 10 | 18,548 | 100.9 | 19,174 | 18,521 | 18,547 | 18,611 | |
| 11 | 18,506 | 100 | 18,506 | 18,506 | 18,509 | 19,316 | |
| 12 | 18,457 | 97.6 | 18,347 | 18,205 | 18,432 | 18,688 | |
| 13 | 18,347 | 100 | 18,347 | 18,347 | 16,842 | 16,839 | |
| 14 | 18,244 | 100.1 | 18,251 | 18,252 | 18,253 | 18,271 | |
| 15 | 18,221 | 98.3 | 18,301 | 18,386 | 18,342 | 17,120 | |
| 16 | 18,025 | 100.1 | 18,035 | 18,064 | 18,006 | 18,006 | |
| 17 | 17,949 | 94.1 | 18,454 | 18,239 | 18,458 | 18,401 | |
| 18 | 17,565 | 100 | 17,565 | 17,565 | 19,221 | 17,565 | |
| 19 | 17,511 | 99.7 | 17,508 | 17,495 | 16,838 | 17,391 | |
| 20 | 17,141 | 100.2 | 17,150 | 17,170 | 16,932 | 16,743 | |
| 21 | 16,320 | 85.2 | 15,666 | 15,069 | 17,862 | 18,093 | |
| 22 | 16,055 | 93.5 | 16,060 | 15,892 | 16,327 | 16,756 | |
| 23 | 15,892 | 109.6 | 16,191 | 17,089 | 15,294 | 15,016 | |
| 24 | 15,510 | 85.5 | 14,898 | 13,743 | 13,692 | 15,438 | |
| 25 | 15,064 | 83.7 | 15,071 | 15,422 | 16,068 | 16,087 | |
| 26 | 14,631 | 88.6 | 14,851 | 14,394 | 14,878 | 14,979 | |
| 27 | 14,552 | 85.4 | 14,615 | 14,091 | 14,850 | 10,776 | |
| 28 | 13,152 | 76.8 | 12,923 | 13,084 | 13,209 | 13,183 | |
| 29 | 12,819 | 81.1 | 12,583 | 12,390 | 13,345 | 14,928 | |
| 30 | 11,949 | 64 | 11,736 | 10,969 | 11,838 | 12,445 |
* NHL attendance figures were taken from ESPN.


